How the online maps were made
The online maps are based on technical assessments using data supplied by NIWA and undertaken by the engineering consultancy Tonkin and Taylor Ltd, which does this kind of assessment for councils around the country.
Tonkin and Taylor calculated extreme coastal water levels for eight different areas (coastal cells) across the whole Nelson coastline for a 1% Annual Exceedance Probability (AEP) (see 'Definitions' below) (1-in-100-year event), now and for different future sea level rise scenarios. These extreme coastal water levels were then mapped against the land elevation in each coastal cell. This is called a ‘bathtub approach’ – imagine a bathtub that fills to equal levels with water across the tub. It is a simple ‘elevation model’.
From the model, the online coastal inundation map viewer was developed. The online maps show a range of sea level inundation scenarios for Mean High Water Springs 6 (MHWS-6) high tide, (see 'Definitions' below) and a 1% Annual Exceedance Probability (AEP) Storm-tide (see 'Definitions' below) for the following sea level rise scenarios:
- Coastal Inundation - Review for NCC - Eco Nomos Ltd
- Tonkin Taylor Coastal Inundation Hazard Report
- Tonkin Taylor Inundation Mapping Letter Report
Map scenarios
- present day - MHWS-6 (coloured in dark blue) and 1% AEP Storm-tide (dark blue hatched)
- 0.5 metres sea level rise - MHWS-6 (coloured in light blue) and 1% AEP Storm-tide (light blue hatched)
- 1.0 metre sea level rise- MHWS-6 (dark green) and 1% AEP Storm-tide (dark green hatched)
- 1.5 metre sea level rise - MHWS-6 (green) and 1% AEP Storm-tide (green hatched)
- 2.0 metre sea level rise - MHWS-6 (aqua marine) and 1% AEP Storm-tide (aqua marine hatched)
The eight areas or coastal cells along the coast line are shown in pink.
Work on the coastal erosion mapping is continuing and it is anticipated that mapping for coastal erosion hazard will be available in late 2022/early 2023.
When will the projected dates for each scenario occur
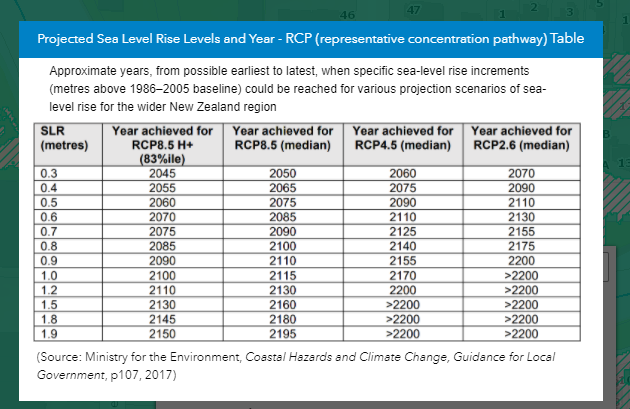
The online maps have a projected date range for each scenario. These projected dates are shown in the table of projected sea level rise dates which is included in the Ministry of Environment guidance document for councils and has been included in the coastal inundation map viewer.
The document contains a table (table 11) with four scenarios (known as Representative Concentration Pathways (RCP) (see definitions at the end of this text) with projected years when a sea level rise scenario may occur. The RCP table can be found under each of the sea level scenarios on the coastal inundation map viewer.
The years for the projected sea levels range from the high risk RCP8.5H+ (83%ile) scenario to a lower risk RCP2.6 (median) scenario, which has a longer projected time frame for the same levels of sea level rise to be realised.
The guidance document and table 11 can be found at the following site.
https://environment.govt.nz/assets/Publications/Files/coastal-hazards-guide-final.pdf
Further information on climate change scenarios for New Zealand can be found at:
https://niwa.co.nz/our-science/climate/information-and-resources/clivar/scenarios#what
As the maps simply show land at or below the elevation of the particular scenario being viewed, the actual extent of the land flooded will be dependent on its connectivity and distance to the coast.
Low lying land not directly connected to the coast may appear on the maps due to its low elevation. These areas are not expected to be subject to seawater flooding as a result of overland tidal flow, but may be subject to ponding due to inflow of seawater through stormwater pipes, elevated groundwater levels or river flooding that may become more prevalent as sea levels rise.
Definitions
Annual exceedance probability (AEP)
The chance or probability of a natural hazard event (such as a storm tide) of a particular size occurring or being exceeded annually. It is usually expressed as a percentage. For example, a 1% AEP event has a 1% chance of occurring in any year
Inundation
Freshwater or seawater flooding of land or buildings. Coastal inundation specifically relates to flooding from seawater.
Mean high water springs (MHWS)
The mean level of spring tides at standard atmospheric pressure. MHWS-6 is the 94th percentile of spring tides (i.e. 6% of spring tides are higher than MHWS‑6). It applies to a high-tide water level as well as the line that marks the landward boundary of the coastal marine area.
Representative Concentration Pathways (RCP)
A standard set of scenarios (pathways) which describe different climate futures, all of which are considered possible depending on how much greenhouse gasses are emitted in future years. The different pathways include different global responses to greenhouse gas emission controls.
Sea level rise (SLR)
The rise in the level of the sea. Relative (or local) sea level rise includes both the change of the level of the sea (such as from global warming) and movement of the land (such as from earthquake subsidence) for the relevant coastal area. Tidal gauges and satellites measure relative sea level rise.
Storm surge
The rise in the level of the sea caused solely by a storm; this is caused by wind and wave action and low barometric pressure.
Storm-tide
The observed seawater level during a storm. It is a combination of mean sea level, high tide, storm surge but excludes wave set up and runup.


